The data clash
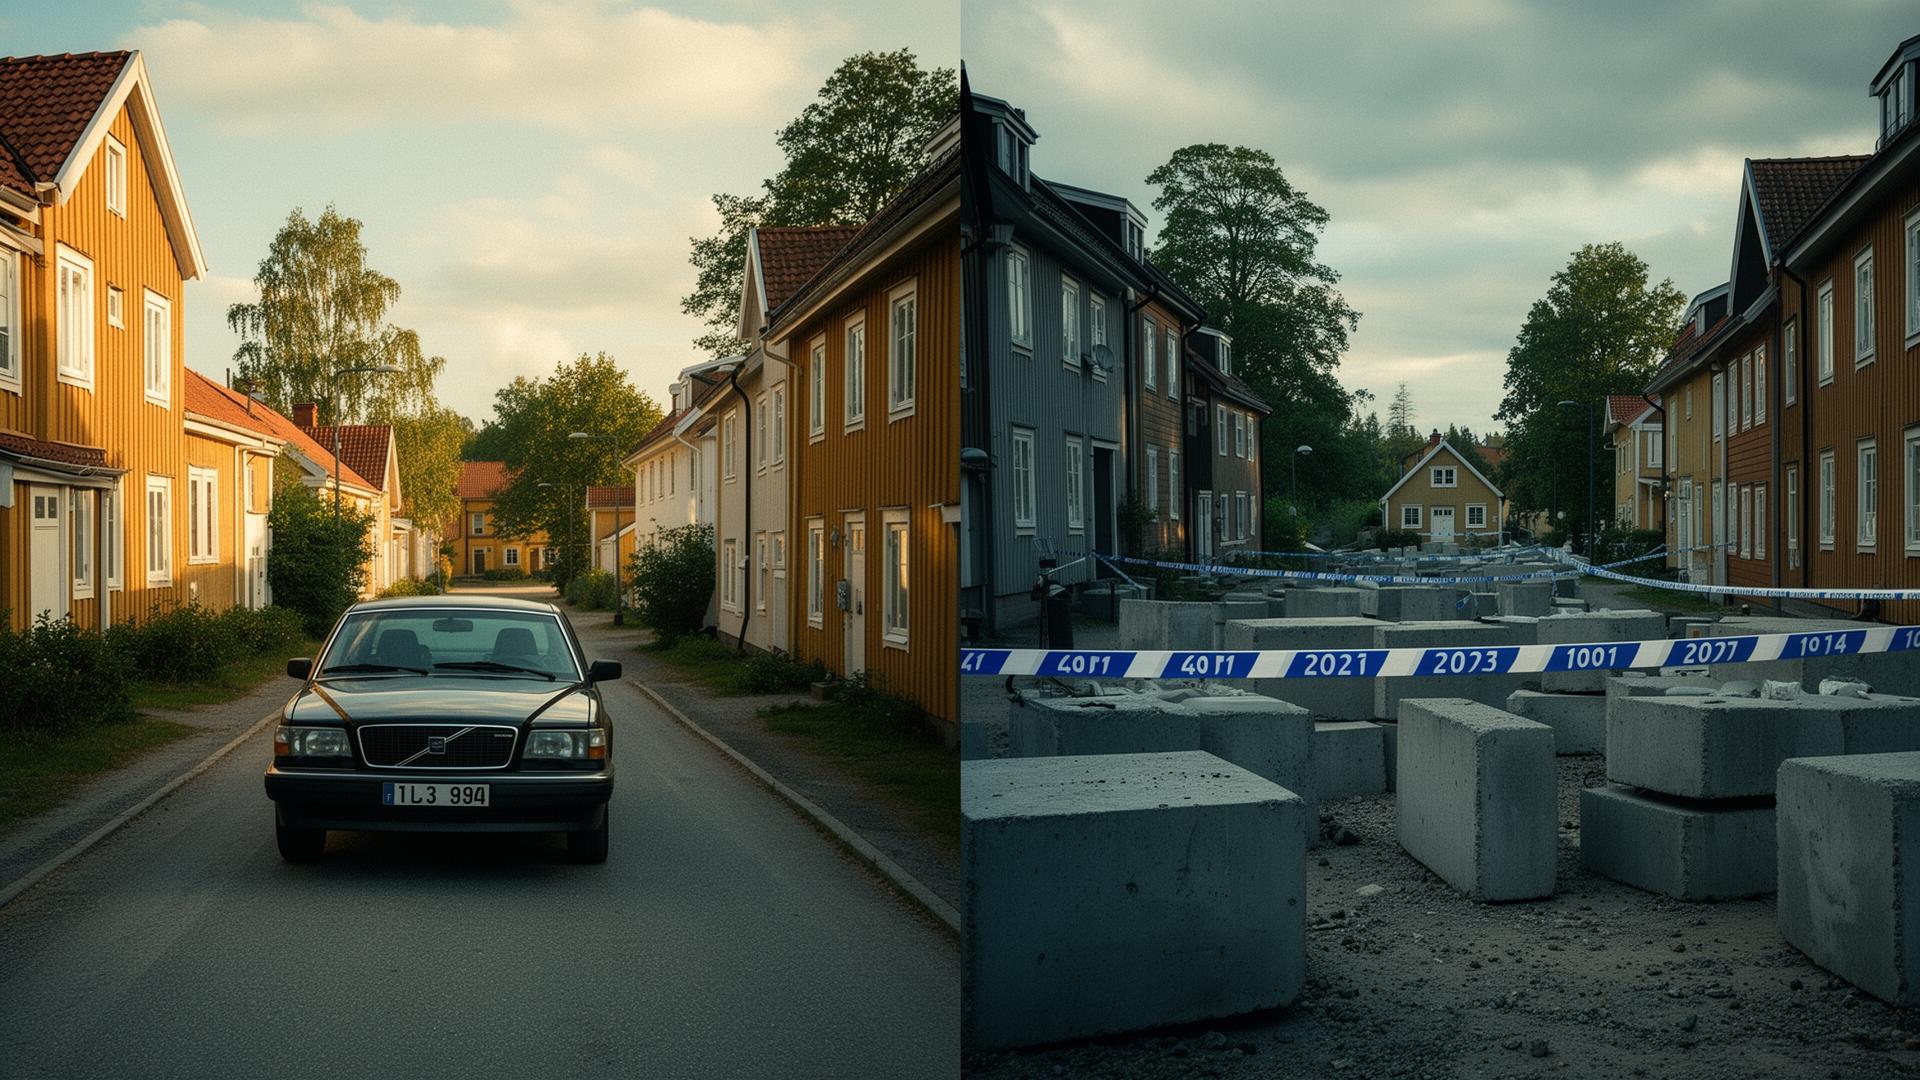
Utopia vs Reality
How to read this
“The data clash” is the gap between the utopia — the image of Sweden as one of the world's best, safest and most equal countries — and the reality in the statistics. The charts below show what the numbers actually say, not what we wish they said.
The data clash is the gap between the common image of Sweden as one of the world's richest countries and the fact that Sweden's OECD ranking for GDP per capita has fallen from 4th (1970) to 18th (2024). Sweden has kept growing, but other countries have overtaken it. At the same time, crime, insecurity and school results have moved in the opposite direction.
Human consequence
Persona
A Swedish citizen who has watched the country for four decades.
Then
- Sweden was an international reference country — welfare, safety, equality, schools, healthcare.
- Stockholm/Gothenburg/Malmö had lower crime than many European capitals.
- Sweden was top 5 in OECD GDP per capita.
Now
- Sweden leads the EU on bombings, lethal gun violence and reported sex crimes per capita.
- OECD rank for GDP/capita: 18. PISA: below OECD average.
- Trust in police, healthcare and politicians is at the lowest level recorded by SOM-institutet (1986–2024).
The Nordics — same metric
Method & uncertainty
Definitions
- — Sidan sammanställer trender från övriga deep-pages. Inga nya tal — alla källor länkas under respektive ämne.
Uncertainties
- — Sammanställning av många indikatorer kan ge bias. Detaljerna ligger i respektive ämnessida.
2035
What do we do if Sweden keeps sliding down the OECD at this rate — and why have neighbouring countries not taken the same path?
On the 2000–2024 trend Sweden leaves the OECD top 25 around 2032.
Read the full investigation of how Sweden has changed.
Back to overview →