The data clash
Utopia vs Reality
How to read this
“The data clash” is the gap between the utopia — the image of Sweden as one of the world's best, safest and most equal countries — and the reality in the statistics. The charts below show what the numbers actually say, not what we wish they said.
Human consequence
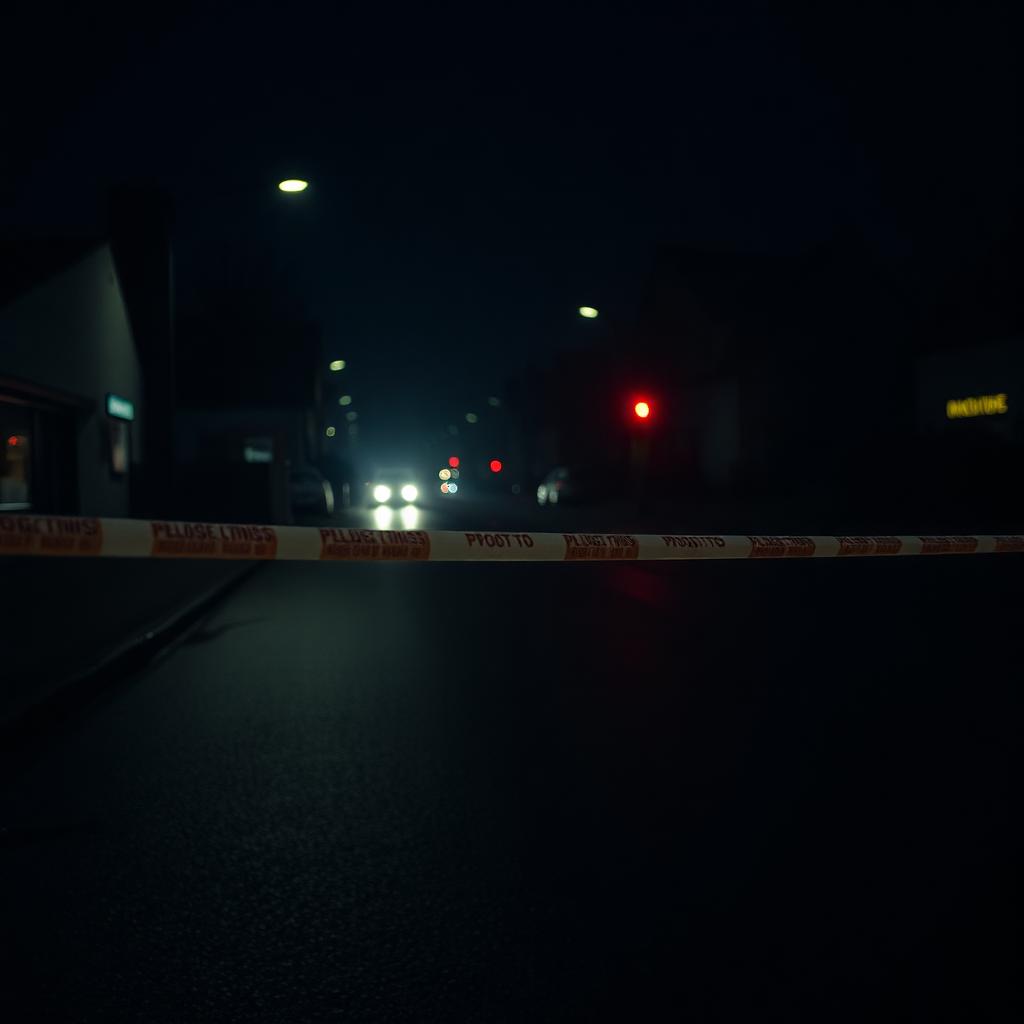
Persona
A patrol officer in the Stockholm region.
Then
- Treated shootings as rare, individual events.
- Carried a service weapon; body armour was uncommon on regular patrol.
- Murder investigations were rare — several years without unsolved gang homicides.
Now
- Murder investigations now run continuously in parallel.
- Body armour and reinforced patrols are routine in several areas.
- Crime scenes involve automatic weapons, often with minors as perpetrators.
The Nordics — same metric
Method & uncertainty
Definitions
- — ”Dödligt skjutvapenvåld” = dödsfall där skjutvapen använts, oavsett uppsåt. Definitionen följer Brå:s årsstatistik.
- — Norge, Danmark och Finland rapporterar via SSB, Danmarks Statistik respektive Tilastokeskus, med snarlika definitioner.
Uncertainties
- — Små absoluta tal i Norge och Finland gör att enskilda år kan slå procentuellt.
- — Klassificering av terror- och hemvärnsfall skiljer marginellt mellan länderna.
2035
What would it take for Sweden's curve to converge back towards Norway's?
Even with a halving every single year from 2024, Sweden would not reach Norway's 2024 level until 2030.
Read the full investigation of how Sweden has changed.
Back to overview →